Sleeping Around 2017-18
 It's that time of year again, time for me to take stock of my life through numbers: it's Sleeping Around Round-Up time!! As I'm sure you all know, I track where I sleep every night and post it for the world to see. Then, every year, I dive into the number to see what it can tell me. Being that this year's data is year 10, perhaps a little extra analysis is warranted. It's that time of year again, time for me to take stock of my life through numbers: it's Sleeping Around Round-Up time!! As I'm sure you all know, I track where I sleep every night and post it for the world to see. Then, every year, I dive into the number to see what it can tell me. Being that this year's data is year 10, perhaps a little extra analysis is warranted.
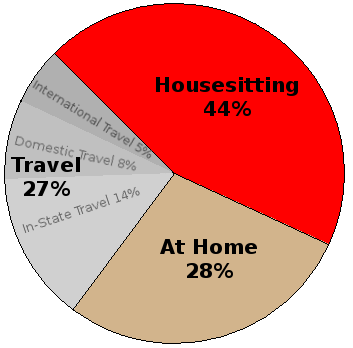
Firstly, as compared to last year and much of the year before, things are a bit skewed. Comparatively, housesitting is way down. But this due to the "Mansion effect", i.e. no longer having the longtime Bellingham stint (posted about here). Looking back to pre-Mansion time, housesitting is up and travel is a bit down, but not too far from normal all around. Other observations:
As always, I encourage you to examine the data yourself and to look back at previous years' posts (which can easily be found from the archive page.) TEN YEARS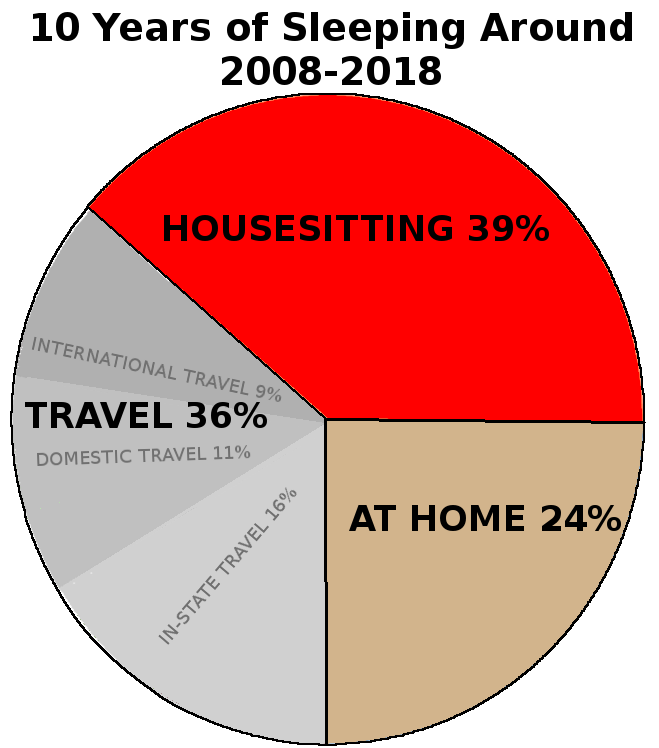 Just for funsies, I did a bit of a 10 year analysis as well. The numbers are remarkably...well, predictable. I guess it turns out that I lead a pretty regular life in some senses. Sure there are spikes in travel or housesitting various years, but afterward, it seems to return to a steady average. Just for funsies, I did a bit of a 10 year analysis as well. The numbers are remarkably...well, predictable. I guess it turns out that I lead a pretty regular life in some senses. Sure there are spikes in travel or housesitting various years, but afterward, it seems to return to a steady average.
A few interesting facts pop out at me, like I've spent 261 nights in a car in the past 10 years and almost a year outside of the country. And some trend emerge, like downward slide in travel and the aforementioned lack of nights in tent. But overall, this data is becoming what data sometimes has a tendency to do: boring. But even thought it may be predictable and/or boring, I still find it incredibly informative. And I hope to have a second 10 years' worth of data to compare to this first decade down the road. 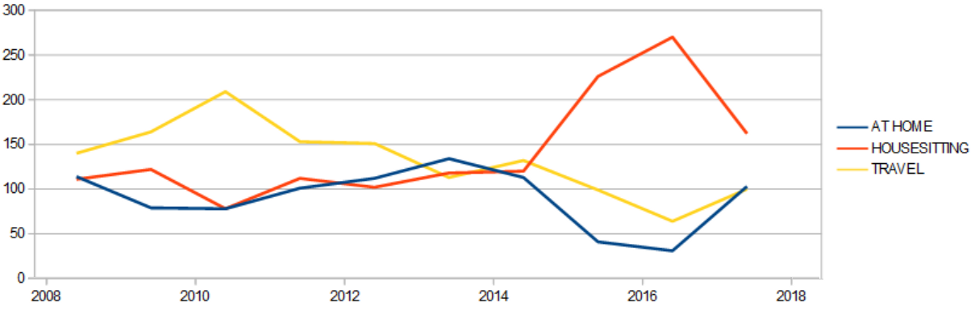
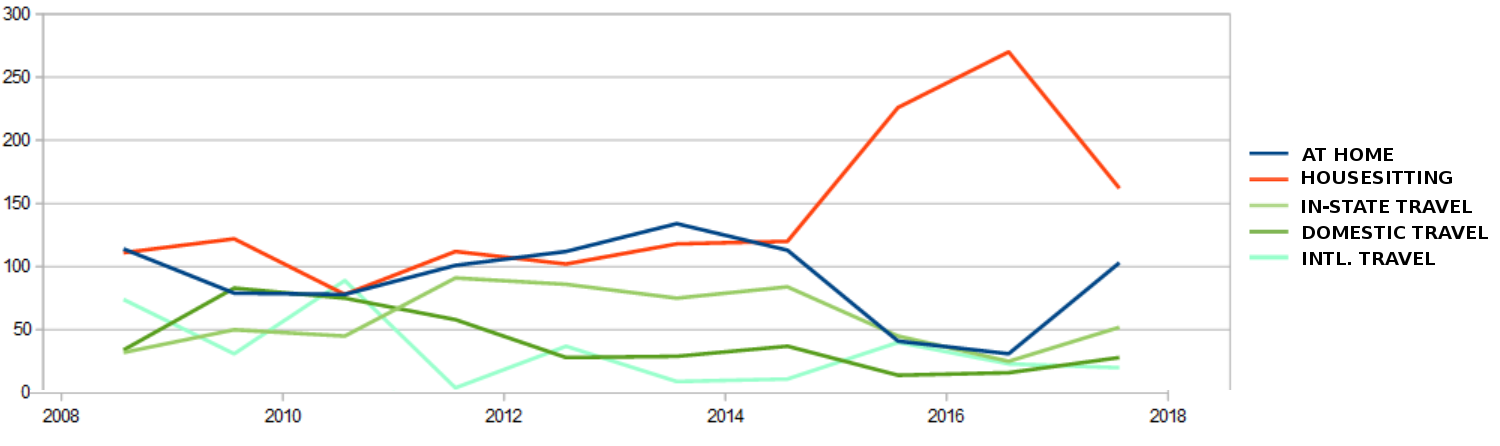
(I originally did this graphic with in-state, domestic, and international travel all separate, but the graph was a bit unwieldy (though still informative)) | ||||||||||||||||||||||||
| Monday August 20 2018 | File under: stats |
| comment? |
| <<EXTRA EXTRA - American Vandal and others | My Second NYT Crossword>> |
Recent Comments:
*Horge on Mother Wrenger in the Nutcracker
*Horge on A Whirlwind Eclipse Adventure
*Andrew on A Whirlwind Eclipse Adventure
*Mom on A Whirlwind Eclipse Adventure
*Mom on Mother Wrenger in the Nutcracker
Recent Content:
*A Whirlwind Eclipse Adventure
*Mother Wrenger in the Nutcracker
*Malta Bene!
*2023 Performance Review
*Twas the Night 2023
*Recycled Plastic Christmas Ornaments
*Halloween Act 2023 - Dueling Banjos
*Walk Like MADD 2023
*New Stilting Costume
*Sleeping Around 2022-2023
*Project Hotdog Halfway Complete
*Giant Juggling Club
Websites du Friends:
* Wren the Juggler
My I-guess-I'm-a-Professional-Juggler juggling website
* Wren and Della
Della and my juggling website
* The Real Food Show
A circus-inspired elementary assembly show to teach kids about healthy eating
* Della Moustachella
Della's performance website
* The Fun Bags
Della and Sadye's Performance Troupe
Tags
Anacortes (39)
Cambodia (5)
China (14)
Korea (1)
Macau (1)
Mexico (13)
New Zealand (1)
Seattle (2)
Thailand (18)
USA (11)
Vietnam (5)
beard (5)
blog (8)
books (1)
coding (15)
comic (45)
contest (4)
environment (9)
events (12)
food (22)
games (15)
geocaching (4)
holidays (13)
juggling (8)
links (9)
meet-ups (1)
mexico (1)
misc (54)
movies (5)
open letter (2)
participation (1)
pics (39)
poetry (6)
poll (1)
quote (6)
road trip (25)
stats (1)
transportation (14)
travel (136)
video (6)
work (8)